Real-Time Asset Monitoring at Your Fingertips

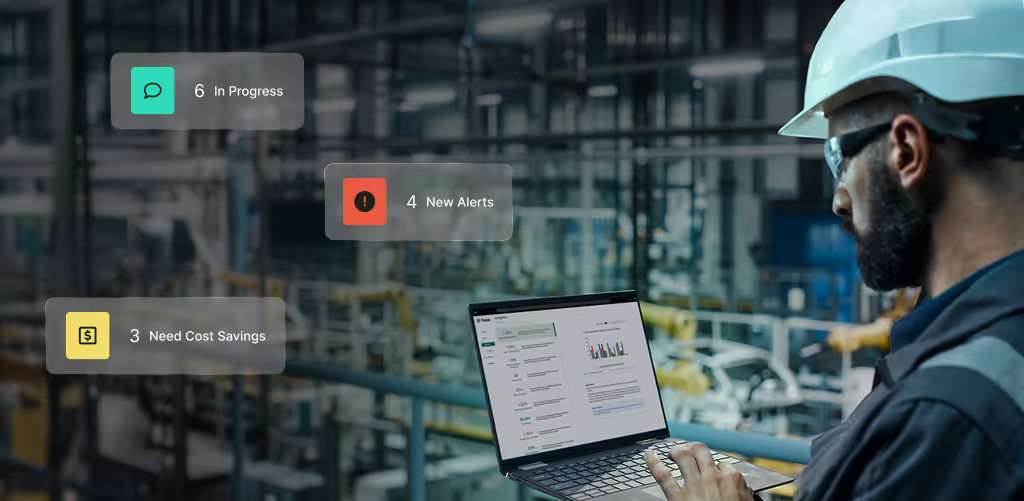
With AssetWatch, maintenance and reliability teams have complete asset visibility at their fingertips. Our platform prioritizes critical issues, delivers expert recommendations, and ensures teams take action before failures happen, all from an intuitive, easy-to-use interface.

Real-Time Monitoring

Real-time asset health monitoring with vibration, oil, and temperature trends

Prioritized Alerts

Prioritized alerts so you can act on the most critical issues first

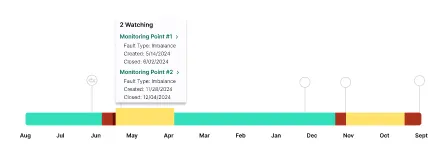
Horizontal timeline bar with months labeled from August to September and color-coded segments, showing two monitoring points active in April with details on fault type, creation, and closure dates.
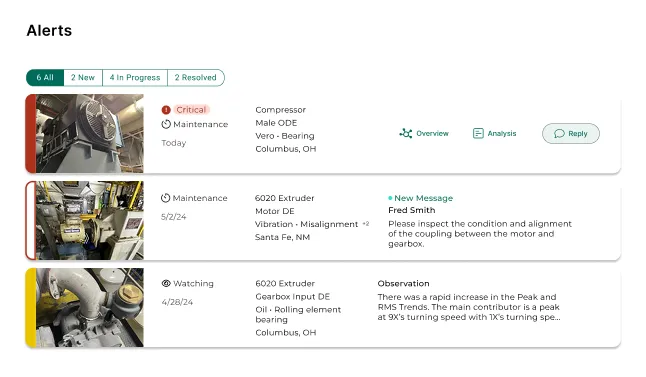
Alerts dashboard showing three equipment maintenance alerts with status, dates, locations, and brief descriptions including a critical compressor alert, a vibration misalignment message for a 6020 extruder, and an observation noting a rapid increase in peak and RMS trends.
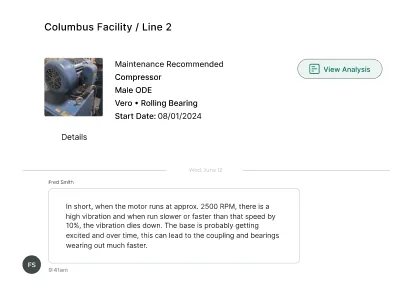
Software interface displaying maintenance recommendation for a compressor at Columbus Facility / Line 2, including motor vibration analysis and start date.

Expert Support

2-way chat with condition monitoring experts for faster resolution

Enterprise Visibility

Enterprise visibility across sites with web and mobile access anytime, anywhere.

See the Full Picture of Every Asset

Understand the health of every machine with a clear, visual summary of past alerts, key metrics, and performance over time.

Failure Pattern Tracking

Asset timeline tracking to identify failure patterns and trends

Horizontal timeline from October to September showing monitoring points with fault type imbalance, highlighted in red and yellow segments for failure tracking periods.

Visual Health Status

Visual health indicators (Red, Yellow, Green) for easy status checks

Dashboard for Columbus Facility showing 200 assets, 78 monitoring points, 3 mobile users, and 10 web users with a horizontal health status bar in green, yellow, and red segments.

Full Asset History

Complete asset history with past alerts and maintenance actions taken
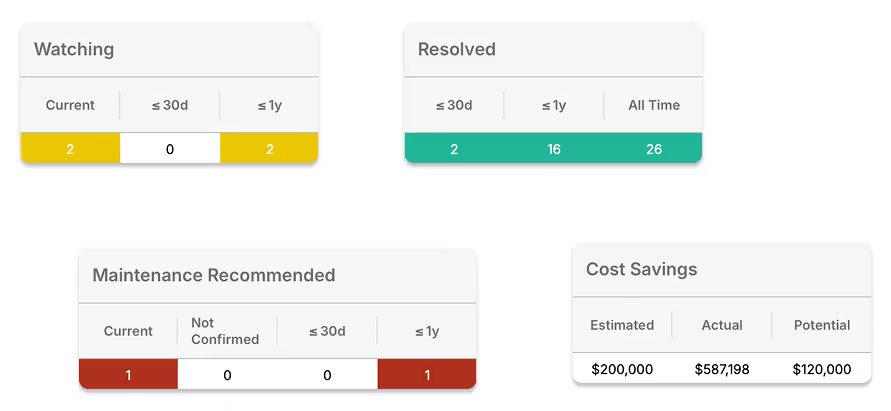
Dashboard displaying four panels: Watching with 2 current and 2 within 1 year; Resolved with 2 within 30 days, 16 within 1 year, and 26 all time; Maintenance Recommended with 1 current and 1 within 1 year; Cost Savings showing estimated $200,000, actual $587,198, and potential $120,000.

Component-Level Insights

Component-level insights to pinpoint problem areas
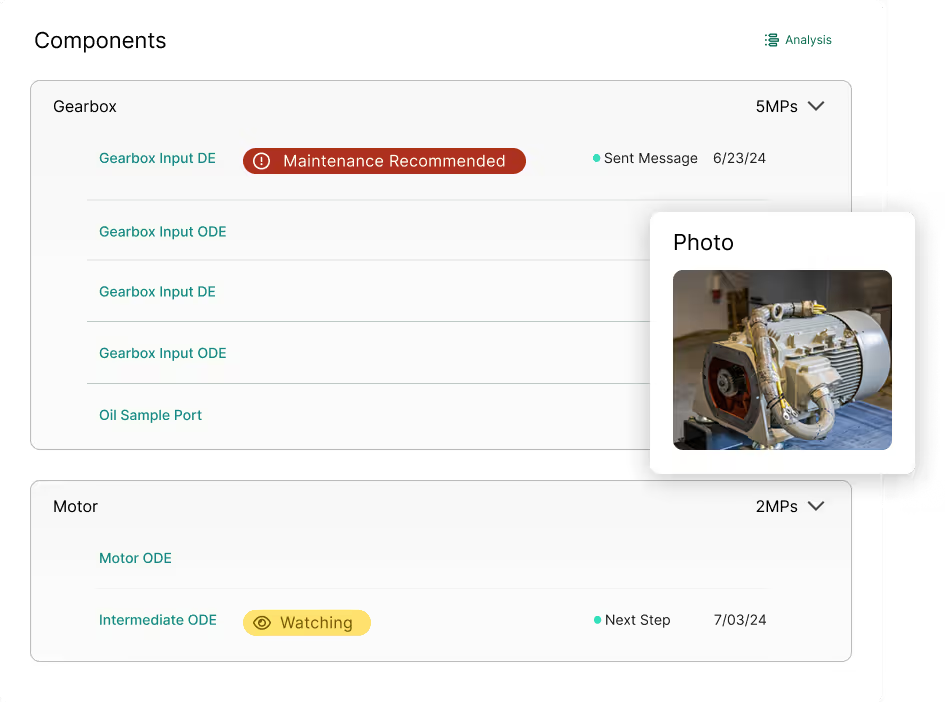
Dashboard showing gearbox and motor component statuses with maintenance recommended for gearbox input DE and watching status for motor intermediate ODE, including a photo of a mechanical gearbox.

Turn Data into Action

Compare your maintenance performance to industry benchmarks or across your enterprise to optimize efficiency.
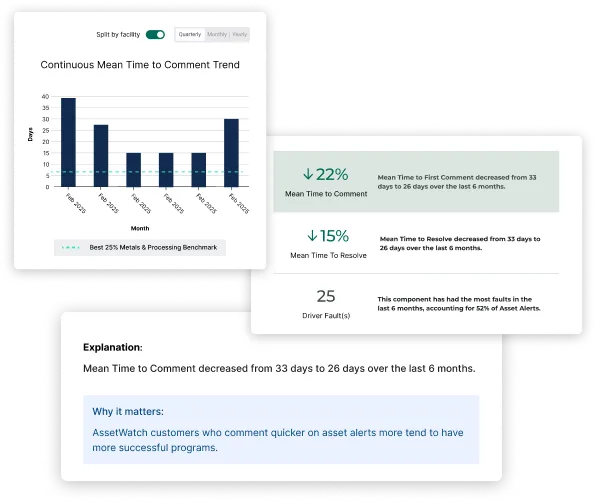
Dashboard showing a bar chart of Continuous Mean Time to Comment Trend from February 2019 to July 2019 with a toggle for Quarterly, Monthly, Yearly, and metrics indicating a 22% decrease in Mean Time to First Comment and 15% decrease in Mean Time to Resolve, plus explanation highlighting improved comment speed correlates with more successful programs.

Maintenance KPIs

Facility-wide KPIs to measure maintenance effectiveness and ROI

Response Time Tracking

Track how quickly your team responds to alerts and resolves issues

Performance Benchmarking

Performance benchmarking against industry standards

Recurring Issue Insights

Identify recurring failures & implement proactive solutions

Enterprise-Wide Visibility

Evaluate performance across all your facilities to drive continuous improvement and operational alignment.

01

Cross-Site Benchmarking

Cross-Site Benchmarking

Cross-Site Benchmarking

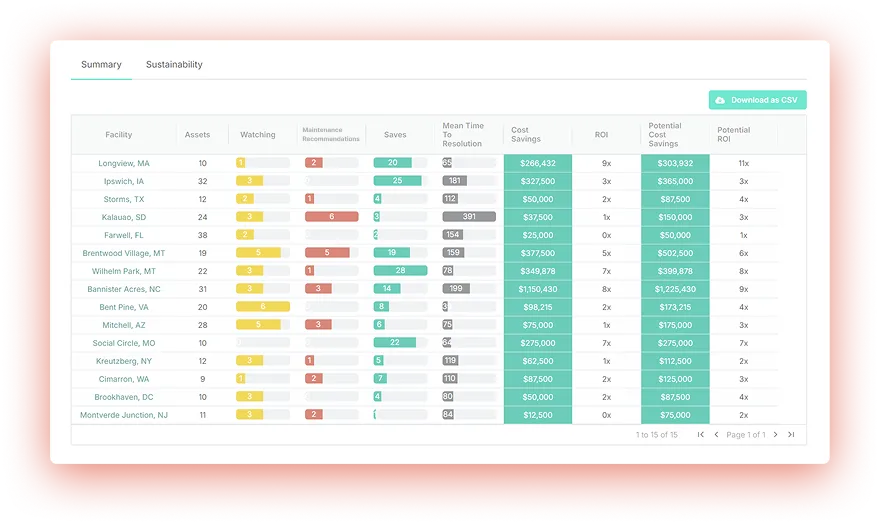
Benchmark performance between facilities to identify improvement opportunities

Dashboard table showing facility data including assets, watching status, maintenance recommendations, saves, mean time to resolution, cost savings, ROI, potential cost savings, and potential ROI with a download as CSV button.

02

Top Performer Insights

Top Performer Insights

Top Performer Insights

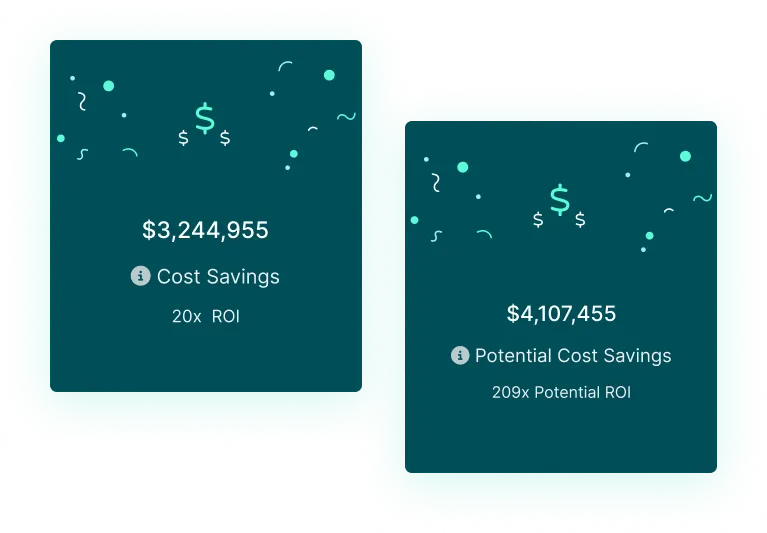
Identify top-performing locations & celebrate successes

Two dark teal squares showing financial metrics: one with $3,244,955 cost savings and 20x ROI, the other with $4,107,455 potential cost savings and 209x potential ROI.

03

Efficiency Opportunities

Efficiency Opportunities

Efficiency Opportunities

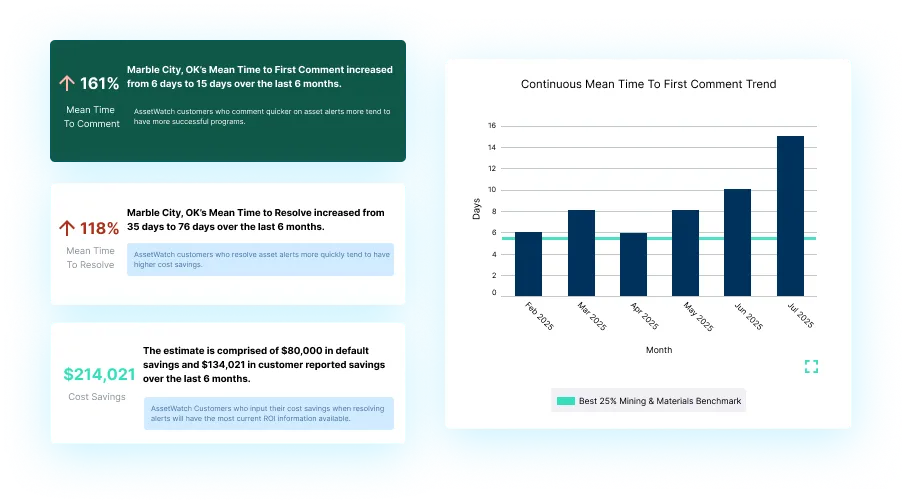
Actionable insights to drive operational efficiency

Dashboard showing increased mean time to first comment and resolve alerts in Marble City, OK, with a bar chart illustrating continuous mean time to first comment trend from February to July 2025.

04

Track Cost Savings

Track Cost Savings

Track Cost Savings

Track cost savings across sites to justify investments

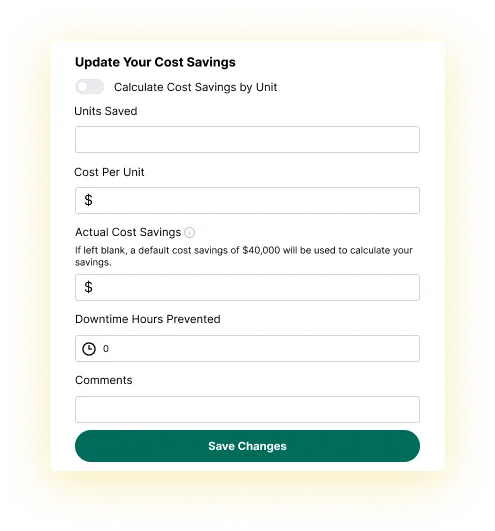
Form interface for updating cost savings with fields for units saved, cost per unit, actual cost savings, downtime hours prevented, and comments, plus a toggle to calculate cost savings by unit and a Save Changes button.

Advanced Vibration & Oil Diagnostics

Access full-spectrum vibration data and comprehensive oil analysis reports all in one platform. Our certified experts analyze the data for you to provide precise maintenance recommendations.

Oil Analysis Reports

Complete oil analysis reports with clear, prescriptive recommendations

Trend Monitoring

Vibration and temperature trends for all your monitored assets

Wear & Life Insights

Proprietary wear rate & machine life calculations for oil-lubricated assets
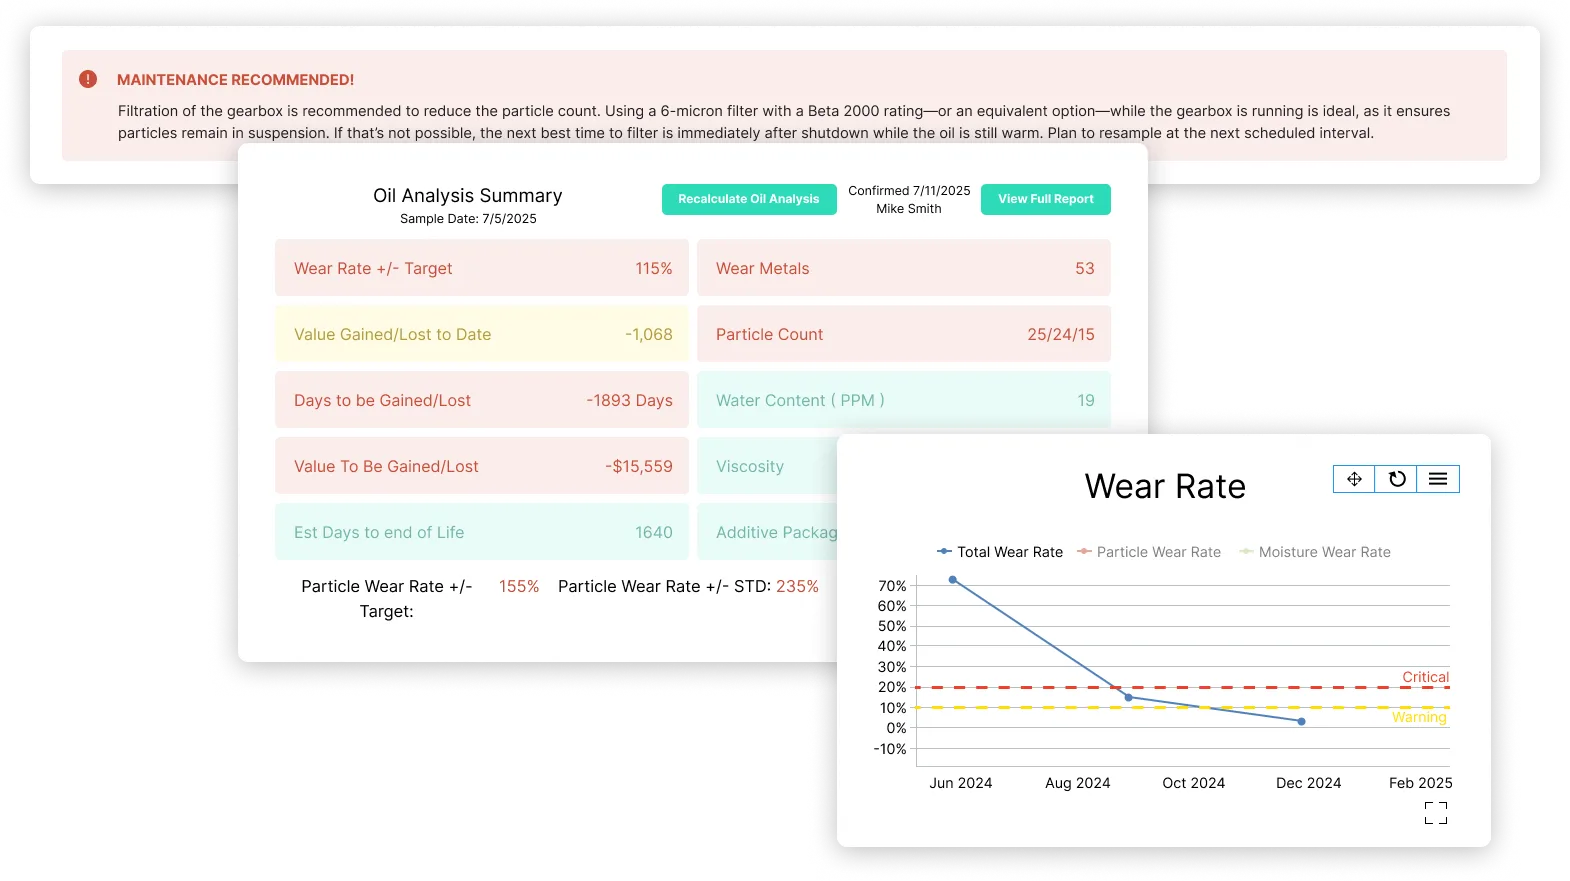
Maintenance alert recommending gearbox filtration with 6-micron filter to reduce particle count. Oil analysis summary dated July 5, 2025, showing wear rate 115%, particle count 25/24/15, water content 19 PPM, and estimated 1640 days to end of life. Wear rate chart from June 2024 to February 2025 indicates decreasing total wear rate approaching warning and critical thresholds.

Expert Support at Every Step

AssetWatch certified Condition Monitoring Engineers (CMEs) ensure you never face maintenance challenges alone.

Expert Chat Access

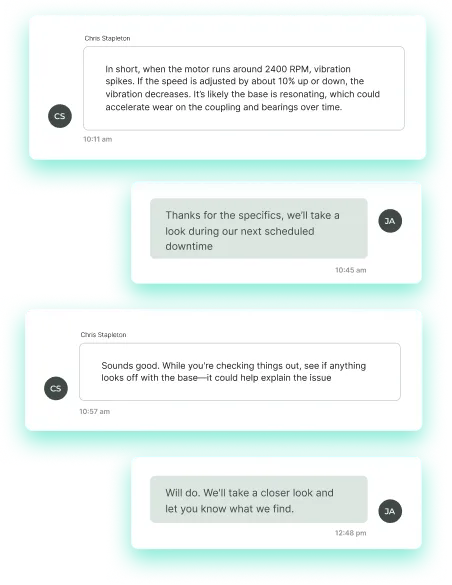
Direct chat with CMEs from any alert for expert guidance

Screenshot of a text conversation discussing motor vibration issues and scheduling a check during downtime.

Data-Driven Guidance

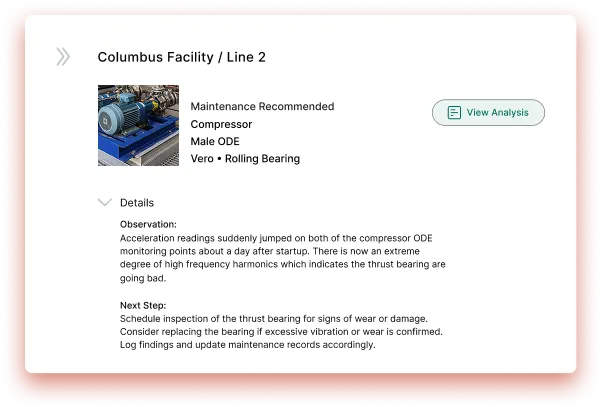
Clear explanations of data trends & recommended maintenance actions

Maintenance report for Columbus Facility Line 2 compressor showing a photo of the compressor and recommendations to inspect and possibly replace the thrust bearing due to abnormal acceleration readings.

AI + Human Insight

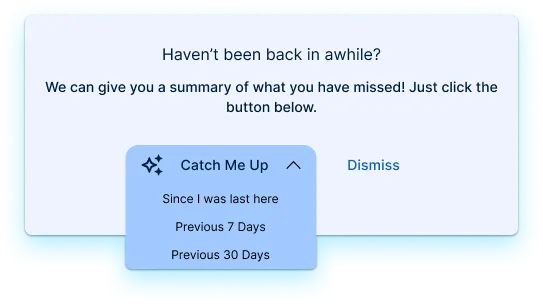
AI-driven insights validated by human expertise

Popup message offering a summary of missed content with a 'Catch Me Up' dropdown showing options for since last visit, previous 7 days, and previous 30 days, and a dismiss link.

Mobile Collaboration

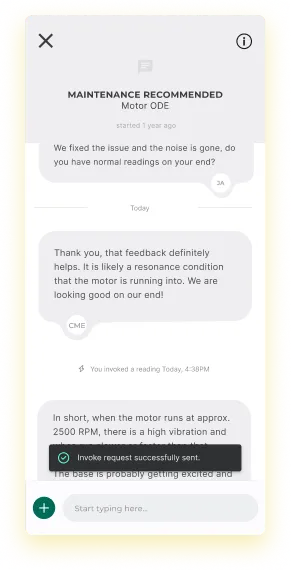
Collaborate with your CME on-the-go through the mobile app

Mobile chat interface showing a maintenance recommendation conversation about motor noise and vibration at 2500 RPM, with a message stating a request was successfully sent.

Don’t Wait for a Failure to Take Action

Reduce downtime, increase efficiency, and take control of your asset health with AssetWatch.
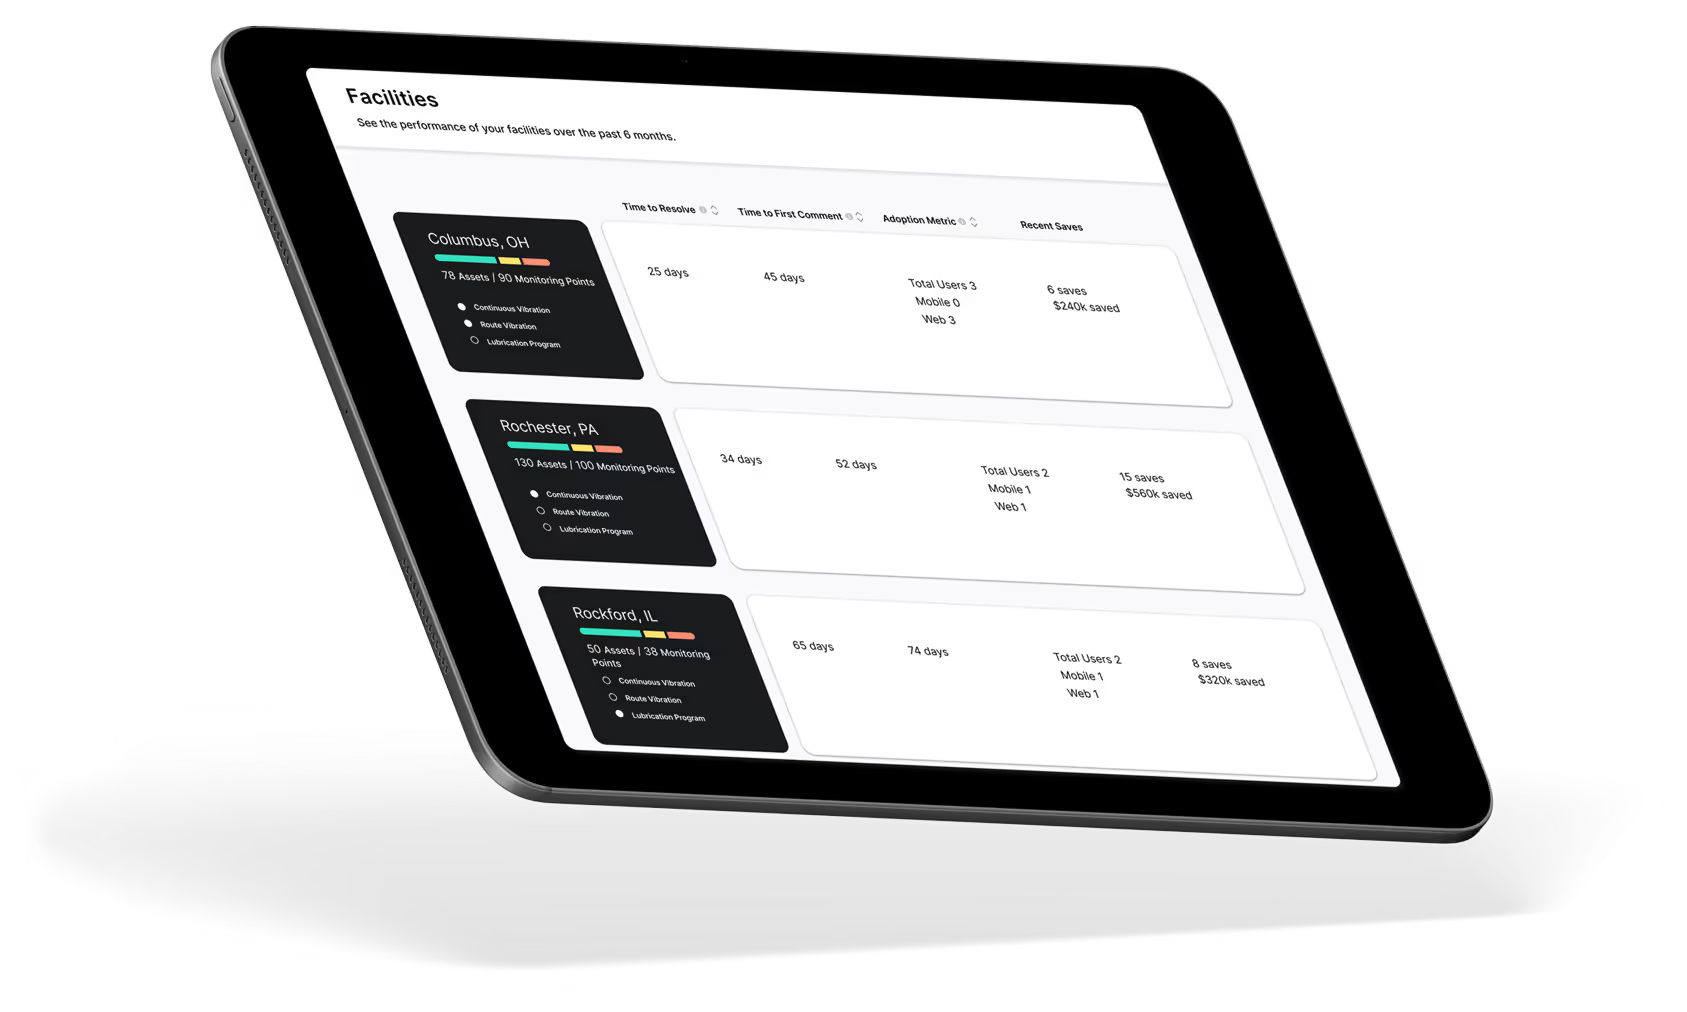
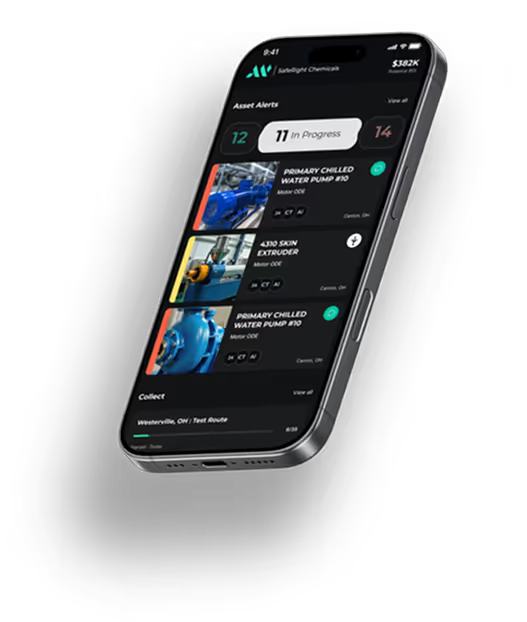
Tablet displaying a facilities performance dashboard showing data for Columbus OH, Rochester PA, and Rockford IL including assets, monitoring points, time to resolve, time to first comment, adoption metrics, and recent saves.Smartphone screen showing an asset alerts app with status indicators for equipment in progress, including chilled water pumps and an extruder with images and condition details.

Fast deployment with no hardware investment required

AI-powered and expert-driven insights for the most accurate analysis

Seamless web and mobile experience for real-time monitoring

Our 30-day, risk free trial is only $199.

AssetWatch customers save on average 8x in ROI. That means for every $1 you give us, we give $8 back to you.

Includes professional installation of up to 200 sensors (a $10k+ value)
24/7 monitoring and a dedicated CME for your site
AssetWatch cloud-based software with unlimited licenses
No CapEx, Engineering or IT integration required